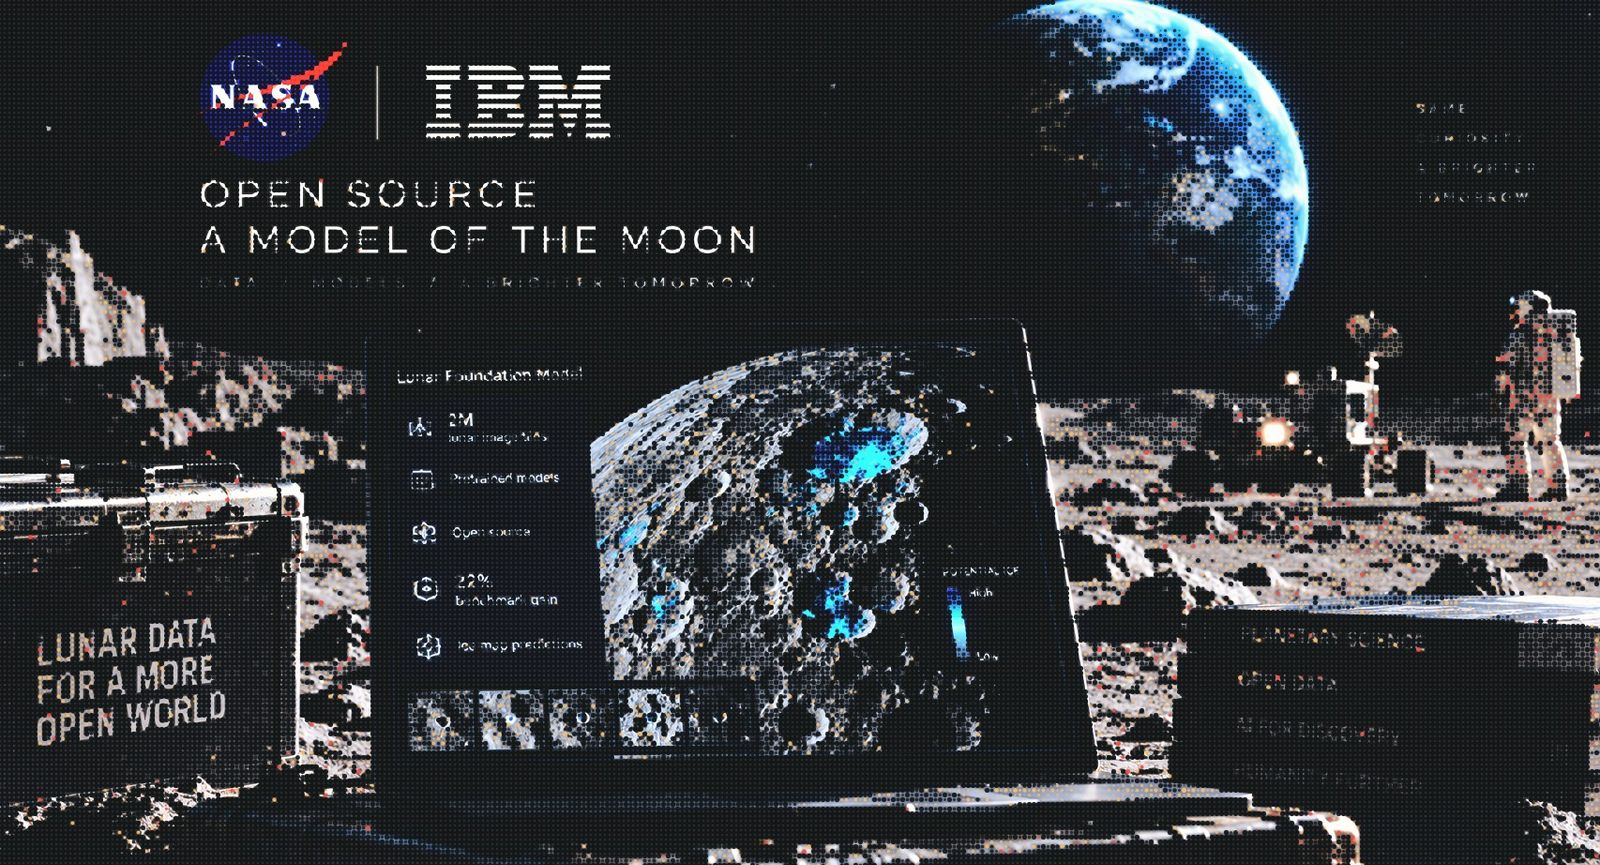

On September 10, NASA and IBM released the NASA-IBM Lunar Foundation Model, a system trained on nearly two million lunar image tiles. Researchers can adapt it to map craters, outline volcanic features and estimate where conditions favor polar ice.
The appeal is practical: a research team can start with a model that has already learned useful patterns in lunar observations, then adapt it to a specific scientific question. The release also gives outsiders access to trained models and test data, so the claims can be examined beyond a launch announcement.
The results reward a closer look. There is a substantial improvement on one benchmark, a useful reduction in the amount of labeled data needed for another, and important limits on what either result establishes.
The hard part is getting different observations to work together
A detailed photograph, a temperature map and a gravity measurement describe different aspects of the same place. Their resolution, coverage and viewing conditions can be radically different. As IBM’s technical overview explains, bringing those observations together is a central challenge in lunar science.
Lighting makes the problem harder. The Moon’s thin atmosphere does little to soften the sharp contrast between sunlight and shadow. Near the poles, low sunlight casts long shadows across the terrain. A surface feature can look very different depending on when and how an instrument observes it.
The model documentation describes a system trained across 11 kinds of input, including imagery, terrain information and observation metadata. It explicitly receives illumination geometry, such as the Sun’s angle, and learns from both roughly one-meter and 100-meter image scales.
During pretraining, parts of the input are hidden and the model learns to predict missing information from what remains. That process builds a reusable representation of relationships between observations. Researchers then adapt the pretrained core for a particular task, rather than learning everything from scratch.
For a scientist, the useful promise is less repeated setup work: the effort invested in learning from one large archive can support several smaller, more focused projects.
What the 22% improvement actually measures
The strongest reported advantage comes from estimating polar ice prospectivity: a score for how favorable a location is considered for ice. The ice model’s published results show a root mean squared error of 0.0293, against 0.0377 for the strongest comparison model, SwinV2-B. Lower is better; that is approximately a 22% reduction.
The crucial detail is the target. The benchmark dataset provides a calculated prospectivity map built from assumptions about temperature, ice stability, shadow and terrain. The AI is learning to reproduce that map. It is not being scored against measurements of ice collected at each location.
A smaller error therefore means closer agreement with that particular scientific model. It does not establish that the AI has found new deposits, measured their volume or identified a mineable resource. The dataset’s authors explicitly note that its assumptions may change as direct measurements improve.
The test also covers only 25 held-out patches from the two polar regions, at 240 meters per pixel. Repeating training runs helps measure variation in the method; it does not turn those patches into a comprehensive survey of lunar conditions.
This still has potential value. An AI approximation can become useful if researchers establish that it helps them investigate new inputs, compare scenarios or prioritize follow-up observations. Agreement with an existing map is an early test of that possibility. The next scientific question is whether the tool improves a decision or reveals something that can be independently checked.
The quieter result: useful performance with fewer labels
The crater-detection results offer another reason to pay attention. On the wide-angle camera benchmark, a NASA-IBM variant trained with half the labeled training data achieved 0.2541 mean average precision, compared with 0.2420 for SwinV2-B using the full training set.
Mean average precision measures the quality of object detection across confidence and overlap thresholds. Higher is better. The comparison suggests that pretraining on lunar observations can reduce the amount of task-specific labeling needed to obtain a useful result. It does not mean the entire project used half as much data: the large pretraining corpus came first.
At meter scale, the leading models were effectively comparable within the reported run-to-run variation. The authors also caution that the crater benchmarks use favorable lighting conditions; performance under very different illumination remains untested.
For mapping irregular mare patches, subtle volcanic landforms, the best NASA-IBM result was likewise comparable to the strongest baseline. The useful finding was that a previously trained core could support the task with only 100 training tiles. The evaluation used just 10 test tiles, so small differences between leading scores deserve little weight.
NASA also demonstrated crater mapping on before-and-after images of a rocket-body impact near Einstein crater. The post-impact image had been excluded from pretraining, and the adapted model highlighted the new feature. NASA’s account notes that changing illumination can still affect the visibility of smaller craters.
Taken together, these results support a reusable tool with advantages on particular tasks. They give researchers a reason to try it without requiring a claim that it wins every comparison.
What you can actually download
The release includes more than a single set of model weights. The official Hugging Face collection contains the pretrained foundation model and task-specific releases for crater detection, volcanic-feature segmentation and ice prospectivity. SomBench provides the accompanying datasets.
The GitHub repository contains code for fine-tuning and running predictions, with TerraTorch integration, configuration files and evaluation commands. It uses the Apache 2.0 license. One qualification is easy to miss: the repository explicitly says pretraining code is not included. The release supports adapting and testing the model, but is not a complete recipe for rebuilding every stage.
For a research group, access to both a trained model and its benchmark is valuable. It enables a more demanding question than whether a demonstration looks convincing: can the result be reproduced, and does it survive changes in the data?
A sensible first project would be deliberately small:
- Choose one task. Use the released crater, volcanic-feature or ice configuration as a starting point, together with its documented data and model files.
- Reproduce a baseline. Check that your setup can recover the published evaluation before treating a new result as an improvement.
- Inspect the mistakes. Review missed features and false detections against the underlying observations, not just a single aggregate score.
- Test a meaningful change. Try a different region, illumination condition or input combination, while keeping genuinely unseen data for evaluation.
This is research software requiring a technical workflow. The model card also excludes operational uses such as certifying landing sites or clearing hazards. Its generated fields are not calibrated scientific measurements; absolute coordinates or elevations can drift.
The larger opportunity is making archives easier to use
The long-term value of this release will be measured in work done with it: better catalogs, stronger comparisons, useful follow-up targets and findings other teams can reproduce. Download counts and attractive maps will be much weaker evidence.
Our assessment is that the most promising contribution is the combination of a reusable model, task-specific examples and inspectable data. That gives a new team somewhere concrete to begin, and gives a skeptical team something concrete to challenge.
The spacecraft have already collected the observations. A well-tested AI tool could help more researchers ask productive questions of them. Every credible new finding extracted from that archive would extend the scientific return on missions already flown.
Sources checked September 14, 2026. Benchmark figures are reported by the development team; we reviewed the release documentation and did not rerun the experiments. Suggested evaluation steps and the closing assessment are editorial analysis.


